Know exactly how many users
you need — before you start
Underpowered tests waste weeks and give false negatives. Overpowered tests waste traffic and delay shipping. Enter your metric and MDE — get the precise number.
Try freeSample size errors are silent — you don't see them in the result
An underpowered experiment looks like "no effect found". An overpowered one ships a regression that looked significant at peek-time.
Too few users
↓ Power
The test lacks sensitivity. Real effects go undetected.
Peeking at results
↑ False +
Stopping when p < 0.05 first appears inflates the actual error rate.
What you enter
Only the parameters that actually matter — no irrelevant fields, no guesswork.
Baseline metric value
Current conversion rate, mean revenue, or baseline ratio. The starting point for effect size calculation.
Minimum Detectable Effect
The smallest lift you care about. Smaller MDE requires more users. Typical range: 1–10% relative change.
Significance level (α)
Tolerated false positive rate. Default 0.05. Tighten to 0.01 for high-stakes experiments or regulatory requirements.
Statistical power (1−β)
Probability of detecting a real effect. Default 0.80. Increase to 0.90 when missing a real win is costly.
Number of variants & split
How many groups (A/B, A/B/C…) and the traffic allocation between them — any ratio, not just 50/50.
Metric type
Conversion (baseline rate + expected lift) or Numeric (baseline mean + standard deviation). Two modes, one calculator.
What you get back
Not just a number. A complete breakdown per variant — with traffic allocation and total sample size.
Sample size per variant
Per each group individually, accounting for unequal splits.
Total across all groups
Capacity estimate for multi-variant A/B/C/D experiments.
Estimated duration
Days to reach required sample, based on daily traffic input.
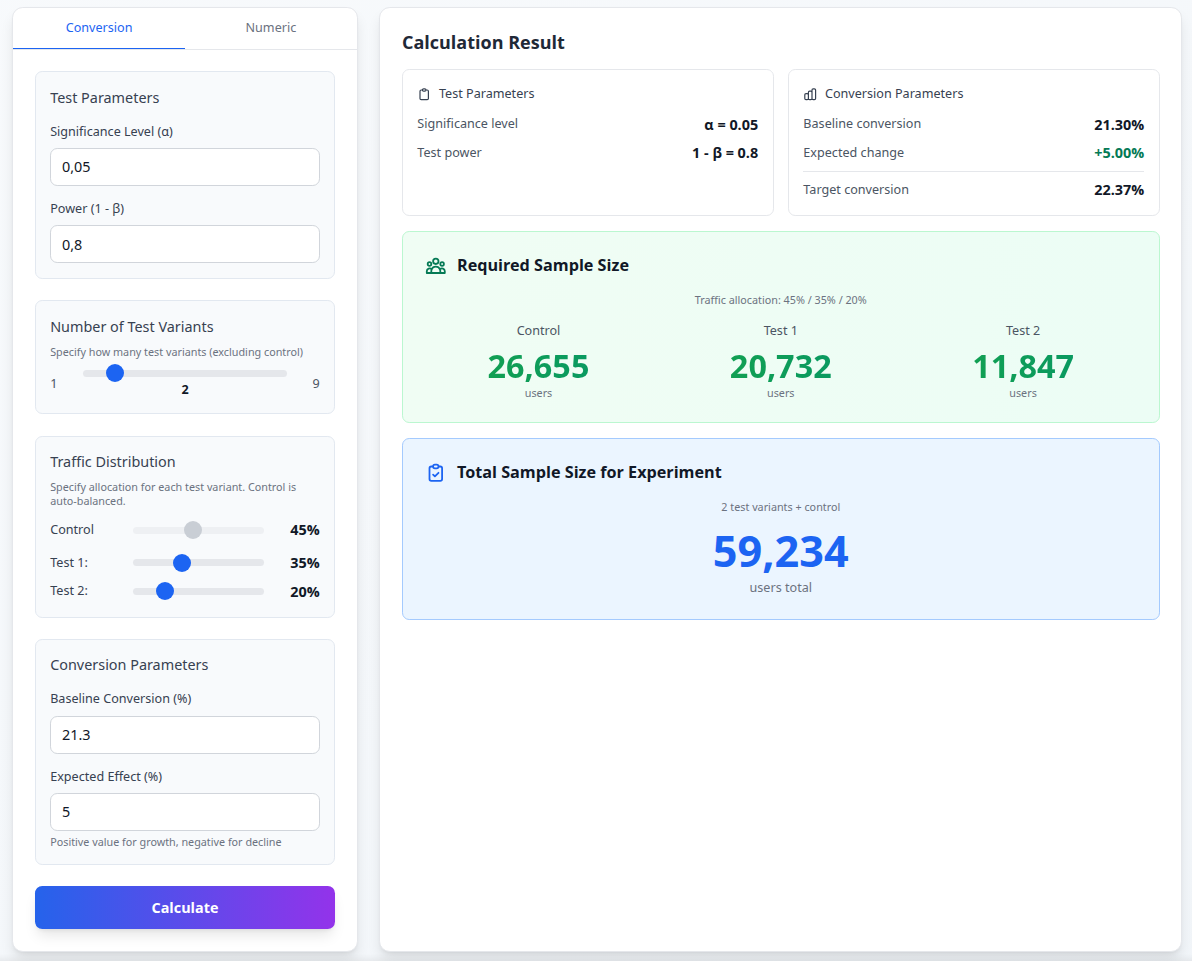
All the metrics you actually measure
Most free tools only handle conversion rates. AB-Labz covers every metric type you work with in real experiments.
Conversion
Click-through rate, purchase rate, sign-up rate — any binary yes/no outcome. Enter your baseline conversion and expected lift.
Numeric / Ratio
Revenue, session time, LTV, AOV, events per session — continuous and ratio metrics. Enter baseline mean and standard deviation.
Built for how experiments
actually run
50/50 splits and two groups is the textbook case. In practice, things are more nuanced.
Multiple variants
up to 10A/B/C…/J — the significance threshold adjusts for multiple comparisons automatically.
Unequal traffic splits
Set any allocation — 80/20, 70/15/15. Useful when protecting the control group or when one variant gets less traffic by design.
Numeric mode covers ratio metrics
AOV, revenue per user, events per session — enter mean + σ in Numeric mode.
Custom α and power
Default 0.05 / 0.80 — adjustable. Tighten for high-stakes decisions, raise power when missing a real win is costly.
Start planning experiments correctly
The calculator is included in the free Solo plan. No spreadsheets, no guesswork.
Register free →