Lightweight A/B testing workspace
Your A/B test results in minutes
Upload a dataset and get a complete statistical analysis — no SDK, warehouse integration, or engineering setup required.
No credit card · No integration required · Free for individual analysts
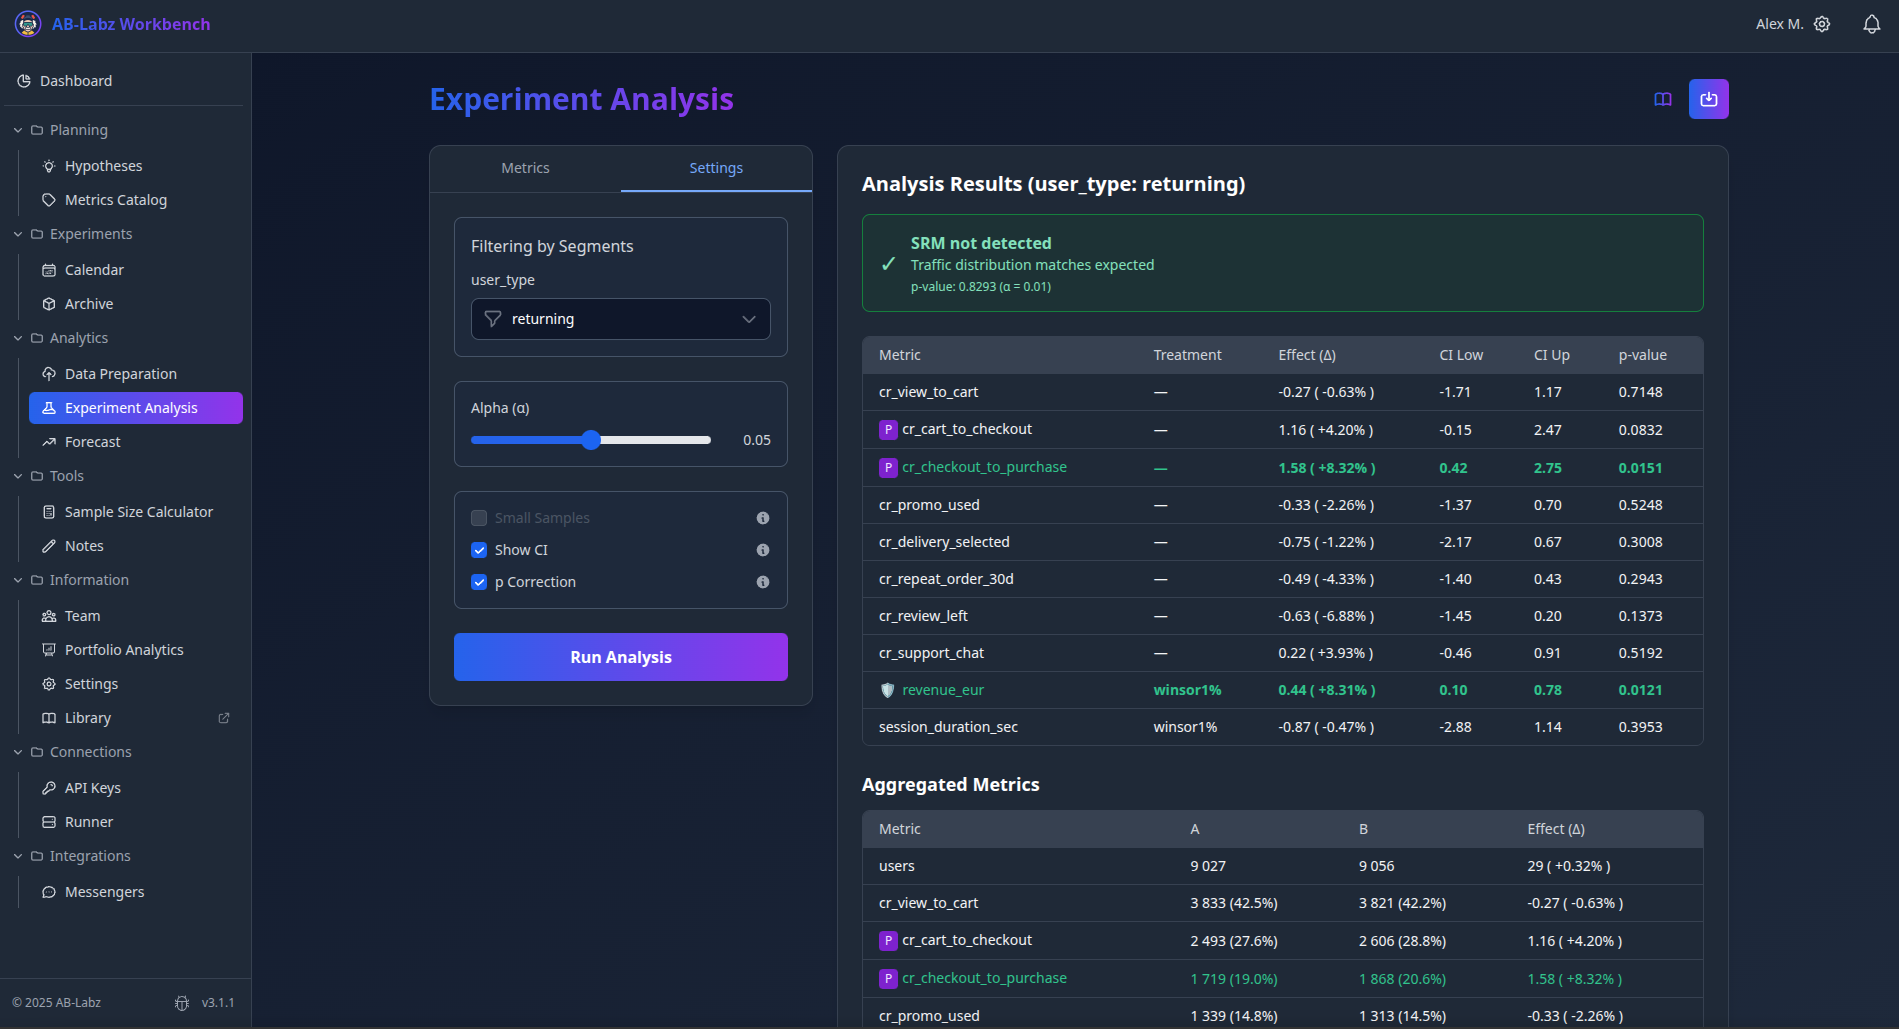
Product tour
See the complete experimentation workflow in one workspace.
Follow an experiment from uploaded data and statistical analysis to hypotheses, decisions, calendar planning, and the searchable knowledge base.
Click the video to watch the guided walkthrough.
Your experiment should not live across five different tools
The hypothesis starts in Jira. The sample size lives in a spreadsheet. The analysis runs in Python. The conclusion ends up in a presentation — and six months later, nobody remembers what was actually shipped.
AB-Labz keeps the full experiment context together without forcing you to rebuild your testing infrastructure.
Start with one test. Build a system over time.
Analyze the dataset you already have. Then add context, export the result, and keep it in a growing experiment archive.
Analyze immediately
Create an account, upload a prepared dataset, and run the analysis. No SDK, data warehouse integration, or engineering support required.
How to prepare the file formatKeep the result
Save the analysis as an experiment record together with its hypothesis, metrics, design, conclusion, and decision. Export to Markdown or share a link.
Grow into a workflow
Add backlog management, scheduling, team collaboration, and portfolio analytics when spreadsheets and isolated calculations stop being enough.
One calculation becomes a full experimentation workflow
From an idea backlog and a testing calendar, through analysis and decisions, to an archive — and a clear view of how the whole experiment program performs.
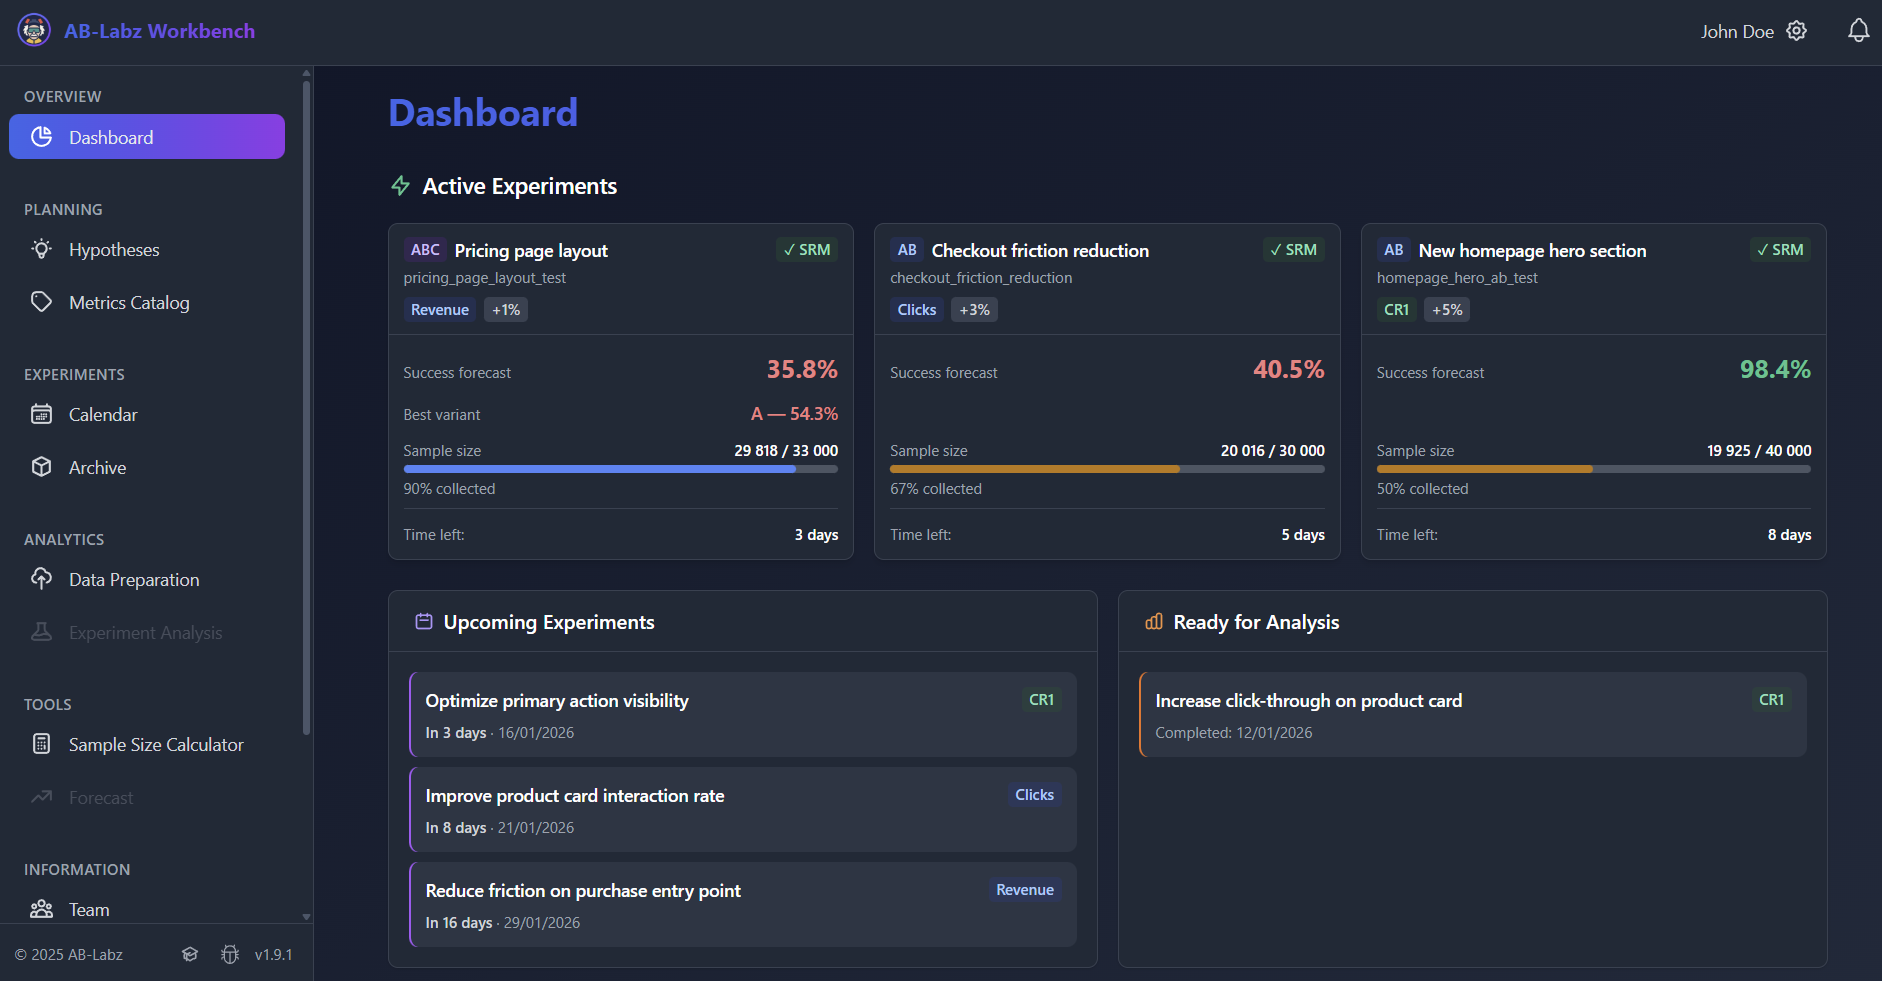
Everything around the calculation — when you need it
Use AB-Labz as a standalone analysis tool or connect each calculation to the wider experiment lifecycle.
Analysis Engine
Upload experiment data, validate the dataset, and get statistically appropriate results with clear conclusions — without rebuilding the analysis from scratch.
Experiment Management
Turn calculations into persistent experiment records. Manage hypotheses, priorities, owners, timelines, and decisions — connected to the actual result.
Portfolio Analytics
NewSee how the entire experimentation program performs — operationally, statistically, and financially.
Know what the experimentation
program actually delivers
Because plans, results, and decisions live in connected experiment records, AB-Labz can evaluate the program as a whole — velocity, signal rate, win rate, capacity, conversion impact, and financial contribution across teams and periods.
No changes to your traffic assignment stack
AB-Labz does not split traffic or replace your feature flag system.
Use GrowthBook, Statsig, PostHog, an internal platform, or any other assignment method. Upload a prepared dataset today, then connect an API or local runner only if automation becomes useful.
No SDK installation. No mandatory warehouse connection. No engineering project required to get started.
Need a split system?
Open-source options like GrowthBook work well underneath AB-Labz. We have a setup guide if you are starting from zero.
Read the setup guide
GrowthBook

Statsig

LaunchDarkly

Unleash

PostHog

Firebase A/B

Amplitude

Optimizely
Your own
One experiment. One continuous record.
A hypothesis does not disappear when the experiment starts. The same record moves through planning, analysis, decision, and archive.
Hypothesis
Capture the idea, metric, MDE, and audience in the same card that will later hold the result.
Design
Sample size, variants, and guardrails stay attached to the experiment — not buried in a spreadsheet.
Schedule
Park the test on the calendar or Gantt so overlaps and free traffic are clear.
Analyze
Upload the dataset and run the full analysis. Results land on the same experiment record.
Decide
Record the conclusion, business decision, and what ships — not just the p-value.
Learn
Cards accumulate into a searchable archive and feed Portfolio Analytics for the whole program.
From the blog
Practical guides on A/B testing, statistics, and running experiments
Calculate A/B Test Sample Size for Numeric Metrics
Conversion calculators are not enough for revenue, order value, and time metrics. Calculate A/B test sample size for numeric metrics, unequal traffic, and real planning constraints.
How to Interpret A/B Test Results (Without Overclaiming)
A significant p-value is not a shipping decision. Read A/B test results through effect size, uncertainty, guardrails, and data quality.
Bayesian vs Frequentist A/B Testing — A Practical Comparison
p-values and posteriors answer different questions. Here's when each framework helps — and when it doesn't — for product experiments.
Start with the experiment you are analyzing today
Create a free account, upload your dataset, and get the result — no integration or team rollout required. When you are ready, keep the calculation as part of a connected experimentation workflow.
Analyze your first experimentFAQ
Can product managers use AB-Labz without a statistician?
Yes. The system automatically selects methods and identifies data issues, and the AI assistant helps understand the tables. A statistician still helps in complex cases — but is not required to run a standard analysis.
How is it different from Google Optimize / VWO?
AB-Labz starts with a prepared dataset, so you can run an analysis without installing an SDK, connecting a warehouse, or changing your traffic assignment stack. Planning, decisions, and portfolio analytics can be added around the result when needed.
Do I need statistical skills?
No. The system automatically selects methods and prepares data. But we provide detailed documentation so you can correctly interpret results.
Does it work with our splitting system?
Yes. AB-Labz does not split traffic — your system does that. Start by uploading a prepared CSV dataset. Connect an API or local runner later if you want recurring updates.
What metrics can be analyzed?
Conversion, numeric, and ratio metrics, including revenue, LTV, CTR, and average order value. The system automatically selects the right test and data preprocessing for each metric type.
What if we have low traffic?
Monte Carlo resampling and Bayesian forecasting support analysis in lower-traffic settings, while the interface clearly surfaces uncertainty and sample limitations.
How is data protected?
AB-Labz offers two data handling options. Via API: data is transmitted encrypted, stored during the experiment, and deleted after analysis completion. Via Runner: raw data never leaves your infrastructure — computations happen locally, only aggregated results without user_id are sent to the cloud. API uses Bearer tokens for authentication. Each organization is isolated.
Are A/B/C tests supported?
Yes. You can analyze experiments with any number of groups. The system automatically determines group count and applies appropriate test classes and data preprocessing.